Held-out constellation points
Each row contains one received complex point, its directly observed FPGA symbol, and the frozen corrected point used for the nearest-state decision.
Download 4,296 pointsPhysical QPSK · receiver path
Physical27 returned all 8,592 checked QPSK bits through one switched FPGA output, a hand-built resonant tank, a nominal 3 dB pad, and an independently clocked RTL-SDR with no observed errors. Carrier-tracked RMS EVM reached 2.0696356%.
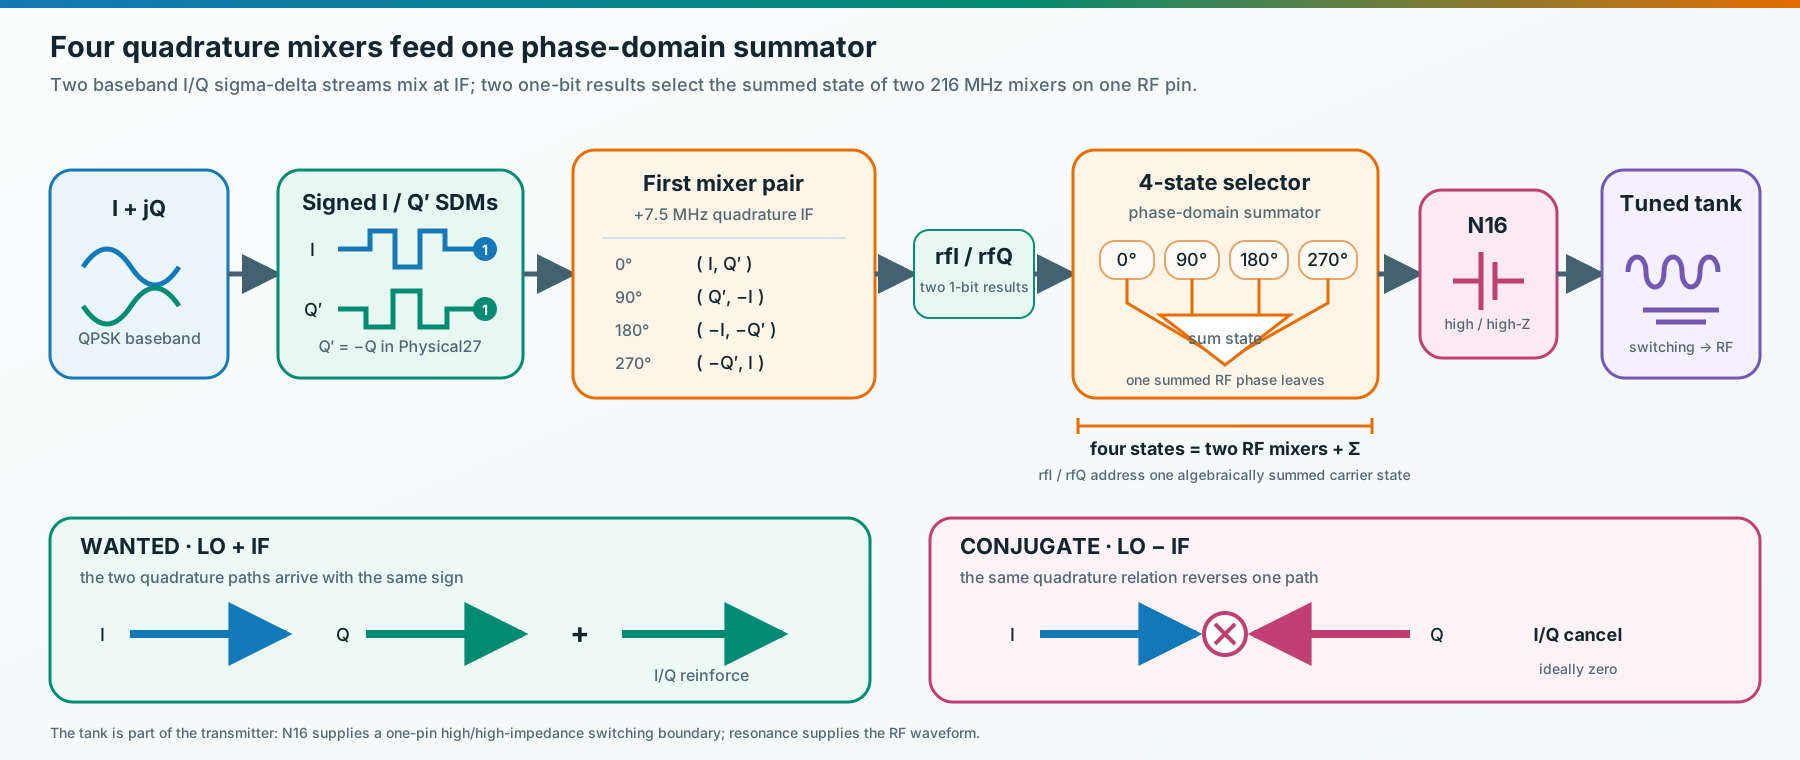
The iCE40 generated its own PRBS16 QPSK, reduced complex I and Q to two one-bit streams, selected among four 216 MHz phases, and drove a single pMOS-switched pad. Direct FPGA telemetry identified the 4,296 held-out symbols that actually occurred in silicon during the nominal three-second burst.
I put the PRBS16 generator inside the FPGA, so Physical27 created its own payload instead of accepting host-streamed samples. The 16-bit register started at 0x1D2B. Lane 62 selected two changing taps, applied its fixed salt, and turned each two-bit word into one of four cardinal complex states: +I, +Q, −I, or −Q.
The lane advanced at 3,295.8984375 symbols/s. Signed first-order sigma-delta modulators converted its I and Q components into two one-bit streams. A common +7.5 MHz Gray rotation moved the entire complex word, rather than offsetting I and Q independently. The rotated bits selected one of the PLL’s four quadrature phases at 216 MHz. N16 then switched high or high-impedance into the resonant network.
The orchestrator opened direct FPGA telemetry and armed the RTL-SDR before loading the volatile CRAM image. The receiver sampled unsigned 8-bit complex values at 2.4 MS/s with its tuner centered at 223.4875 MHz. The wanted QPSK lane sat 75 kHz above that center, at 223.5625 MHz.
N16 stayed active for a nominal three seconds. The capture also retained RF-off samples on both sides of the burst. Afterward the transmitter returned to high impedance, and postflight telemetry counted 22,528 idle frames with no burst-active, physical-RF-pulse, or TX-LED assertion.
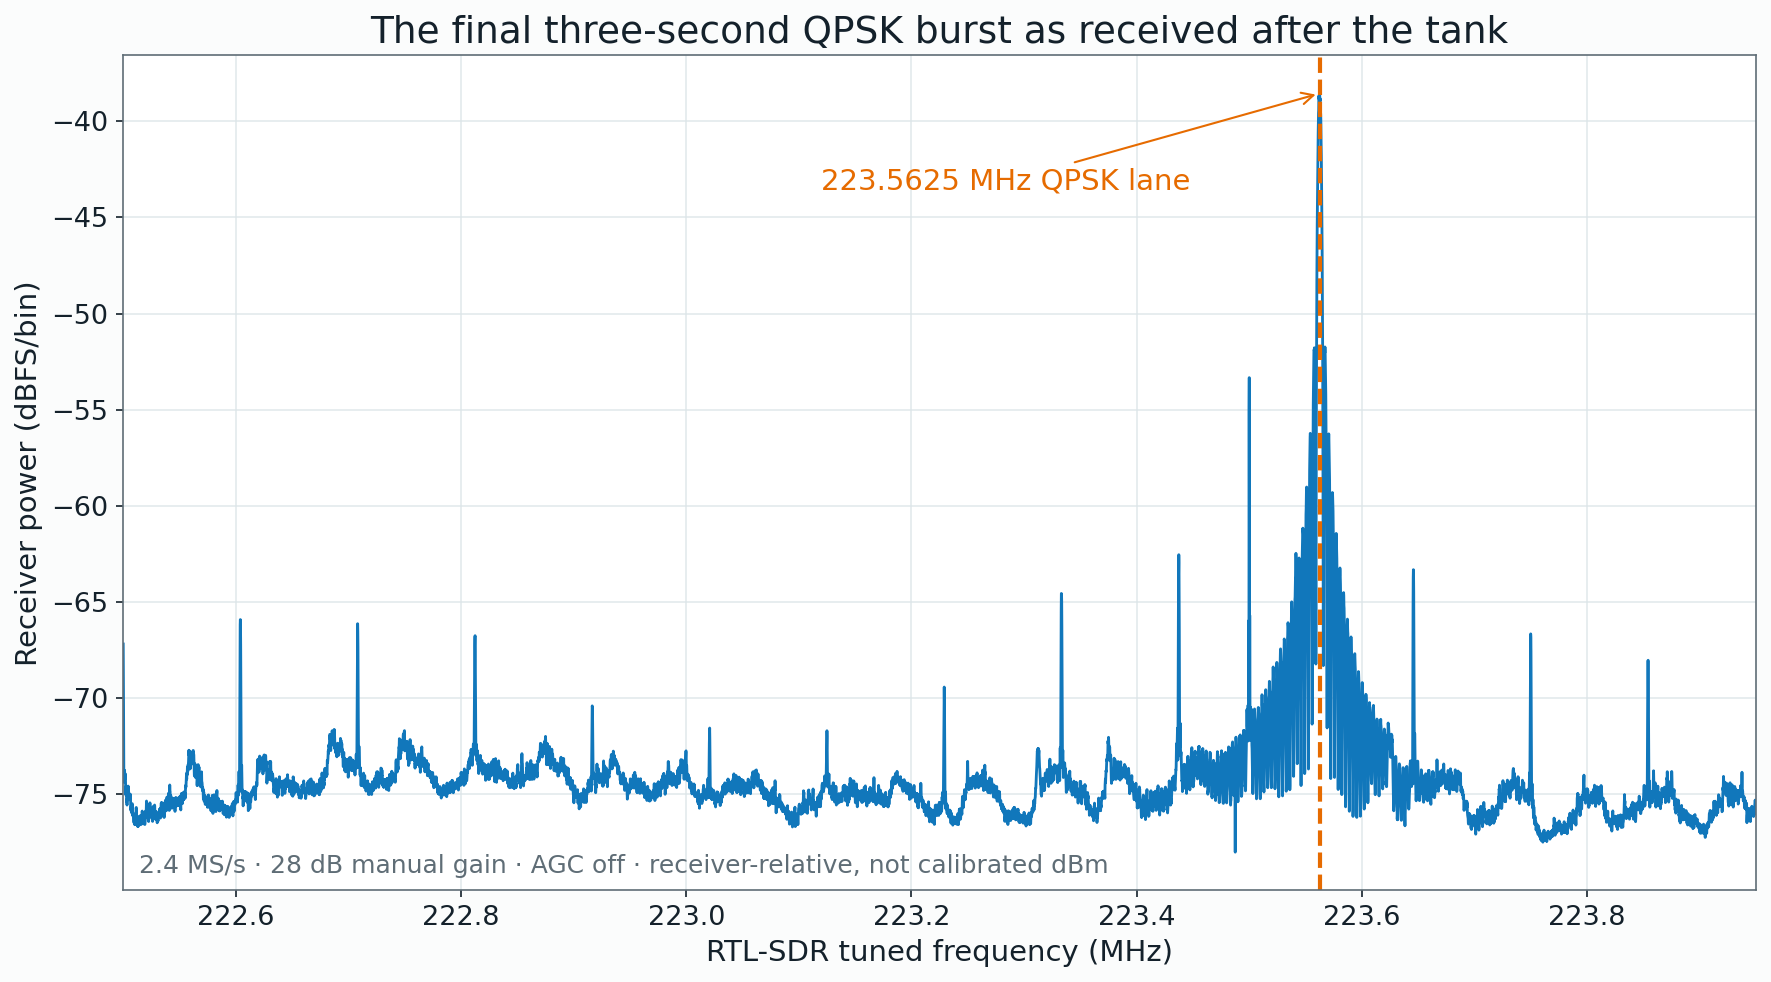
The receiver and FPGA ran on independent clocks. The captured waveform supplied carrier and timing, while direct telemetry supplied the precise transmitted symbol only at epochs that reached the host.
The first 993 directly observed symbols supplied the timing, orientation, complex gain, offset, and tracker-width choices. The held-out interval then began at zero-based epoch 4,200 and ended before epoch 9,823. The receiver held those settings fixed while phase continued to follow the received waveform.
The nominal held-out span contained 5,623 epochs. Direct telemetry reached 4,296 of them and left 1,327 holes inside that span. The score inferred, interpolated, and counted no symbols in those holes. Across the complete run, telemetry left 2,332 epochs absent.
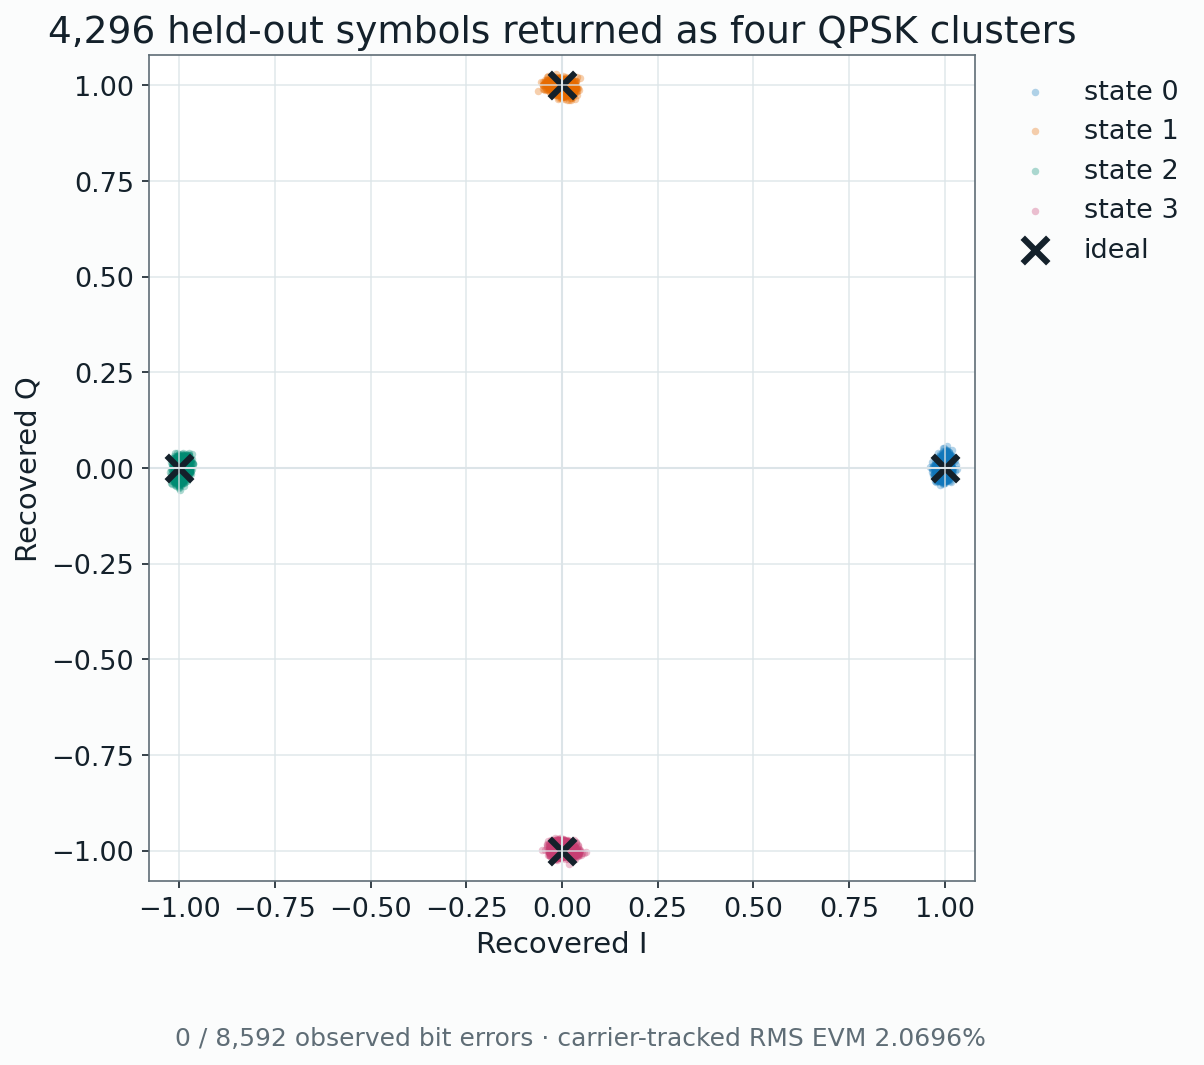
Hard decisions used the nearest of the four cardinal QPSK states. All 4,296 held-out symbols selected the intended state, so the two-bit mapping produced 8,592 checked bits with zero observed errors. Normalized complex correlation reached 0.999584. Eleven local time windows stayed between 1.9828% and 2.1650% RMS EVM.
This finite burst records a precise engineering result: every directly paired held-out symbol in Physical27 survived the complete one-pin FPGA, tank, pad, and receiver path. A BER curve offers the next expansion through many more bits, repeated bursts, controlled received level, temperature and supply variation, and failures as well as successes.
Each row contains one received complex point, its directly observed FPGA symbol, and the frozen corrected point used for the nearest-state decision.
Download 4,296 pointsThe small standard-library Python program recomputes symbol errors, bit errors, RMS EVM, and normalized correlation from that table.
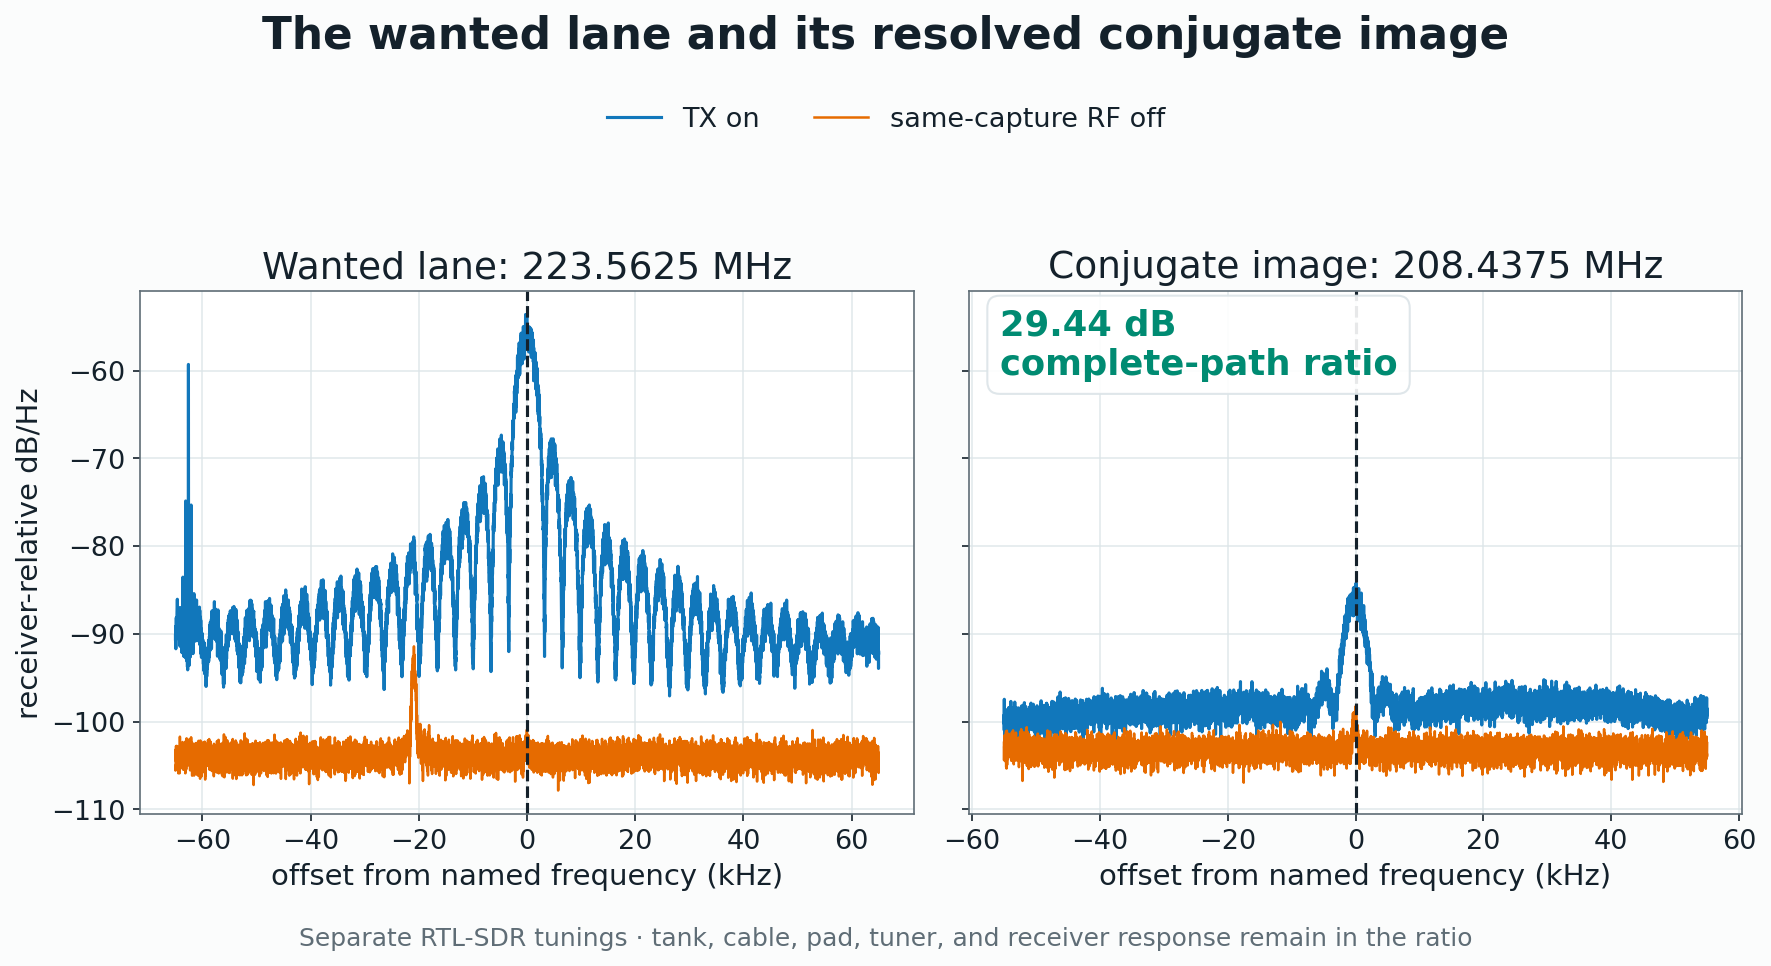
Open the scoring programPhysical28 kept the FPGA image, receiver gain, sample rate, path, and duration unchanged, then moved only the RTL-SDR center to the 208.4375 MHz conjugate-image region. Signed excess power in the predeclared 25 kHz wanted and image windows gave a 29.443932 dB wanted/image ratio.
Two sequential RTL-SDR tuner settings measured the regions. The resulting complete-path ratio includes the tank, cable, nominal 3 dB pad, tuner response, receiver response, independent clocks, and the time between captures; it reports more than device-only Weaver cancellation.
Host arrival times paired thousands of low-rate symbols, while a common trigger or clock can add sub-symbol timing that USB telemetry cannot provide at 216 MHz. Repeated controlled bursts can then sweep received level, temperature, supply, tap settings, tank loading, and symbol rate while keeping the same physical reference plane.
The stronger 216 MHz term remains a separate transmitter problem from the conjugate image. The next receiver can follow information recovery, carrier feedthrough, image behavior, and wideband flatness as four distinct consequences.